Trading Performance
Why Knowing You’re Profitable Isn’t Enough
Understanding trading performance beyond the headline profit

Profit is only one part of the story
If you finish a trading period with more money than you started with, that is naturally good news. But a positive result alone does not tell you how well your trading method is working, how much risk you took to achieve it, or whether the performance is repeatable.
Imagine two traders. The first earns €1,000 while keeping drawdowns relatively small and consistently following a plan. The second also earns €1,000, but takes large positions, experiences a substantial drawdown, and relies on a few fortunate trades to rescue the period. The reported profit is identical; the process behind it is very different.
The real question is not simply whether you made money. You also need to examine how the result was produced, what risk it involved, and what the data can tell you about your next trades.
Net profit matters, but it does not explain everything
Net profit or loss is a useful starting point: it shows where you stand financially over a given period. It does not reveal how much risk you took, how volatile your results were, or how dependent you were on a few unusually large trades.
Performance should be evaluated after costs. Commissions, spreads, financing charges and other transaction costs can materially change the result you actually keep. When comparing periods or strategies, costs and currencies should be treated consistently.
Profit answers how much you gained or lost. It does not fully answer how efficiently or at what level of risk you achieved that result.
Win rate: how often do you close a trade in profit?
Win rate is the proportion of closed trades that were profitable. If 60 out of 100 closed trades made money, your win rate is 60%. It is useful, but it does not prove on its own that a strategy is profitable.
Suppose a trader makes €100 on eight out of ten trades but loses €450 on each of the other two. The winning trades generate €800, while the losing trades cost €900. The win rate is 80%, yet the total result is –€100 before costs.
Win rate must therefore be interpreted alongside average win and average loss. A high win rate can be an advantage, but only if the size of wins and losses, together with costs, allows for a sustainable result.
Average win, average loss and expectancy
Average win is the mean result of profitable trades; average loss is the mean loss of losing trades. Together, they help you understand how much you typically make when you are right and how much you lose when you are wrong.
A simple estimate of expectancy before costs is: expectancy = (win rate × average win) − (loss rate × average loss).
For example, with a 50% win rate, an average win of €200 and an average loss of €120, expectancy per trade is: 0.5 × €200 − 0.5 × €120 = €40. This indicates a positive average result in the simple model, but it is not a guarantee of future performance. Costs, changing market conditions and sample size all matter.
Expectancy is most useful when calculated from a sufficiently large set of comparable trades, without retrospectively changing the rules just to make the numbers look better.
Profit factor: the relationship between gains and losses
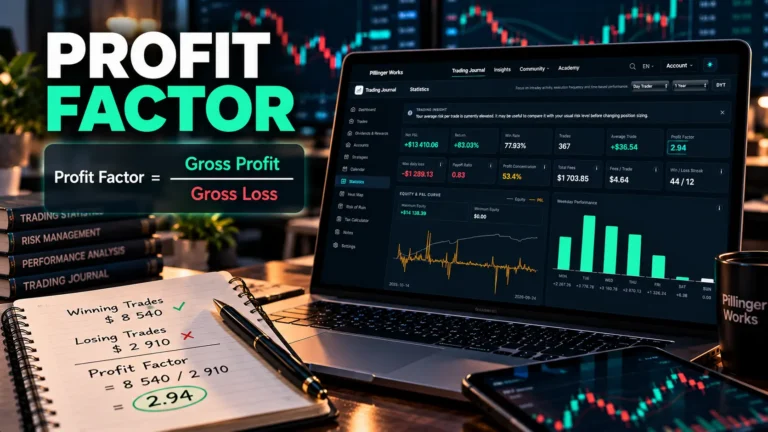
Profit factor is calculated by dividing gross profits by the absolute value of gross losses. If winning trades generated €3,000 in total and losing trades cost €2,000, the profit factor is 1.5.
A value above 1 indicates that gross profits exceeded gross losses during the period studied; a value below 1 indicates the opposite. The metric should not be viewed in isolation: the same value can come from many small trades or a few extreme outcomes, and the treatment of costs also matters.
Profit factor is a useful summary, but on its own it does not show maximum drawdown, the variability of results over time, or how heavily performance depends on a handful of exceptional trades.
Drawdown: how much of a decline did you have to withstand?
Drawdown describes a decline from a previous peak in capital or in an equity curve. Maximum drawdown is the largest peak-to-trough decline during the period studied, depending on the calculation method used.
Two traders can have similar net profits even though one experienced a much larger drawdown. A deep drawdown can be financially and psychologically demanding, and it takes a larger percentage gain to recover lost capital. After a 20% loss, for example, a 25% gain is needed to return to the starting level.
Drawdown helps you assess whether a strategy’s risk profile is compatible with your financial circumstances and your ability to withstand losses.
The quality of the result: disciplined decisions or luck?
Alongside the statistics, record whether you followed your trading plan. A profitable trade can still be a poor decision if the entry broke your rules or involved unjustified risk. A losing trade can be well executed if the setup met your plan, risk remained controlled, and the market simply moved the other way.
You can group trades by strategy, instrument, direction, holding period or adherence to your plan. This may reveal whether a particular market or situation consistently works better for you, and which decision patterns are hurting your results.
Data does not replace judgement, but it can help distinguish recurring patterns from impressions driven by chance.

Would like to learn about the market and trading?
You are in the best place! Our 5 levels Academy system free for everyone. After a short registration, you can easily follow your learning process and There is also a certificate for your perseverance! The whole from beginners to expert level.
How to build a useful performance review
Choose a regular review period, such as the end of each month. Record net results and costs, then review at least win rate, average win and loss, expectancy, profit factor and drawdown.
Break results into groups that can inform real decisions: strategy, asset class, long versus short trades, holding period or adherence to your trading plan. Avoid sweeping conclusions from only a handful of trades; small samples can be misleading.
Define one or two specific, verifiable next steps. For example, track one strategy separately next month, record the planned rationale for every trade, or examine which instruments generate the highest costs. The goal is not to make every metric look good, but to make better decisions.
How the Pillinger Works Trading Journal can help
The quality of performance analysis depends on the data you record and how consistently you record it. If trade details are missing, your later review will rely on memory and impressions.
A well-structured trading journal can keep trade information in one place and help you review results by period, strategy or instrument. Pillinger Works Trading Journal provides a framework for this process: by organising trading data and supporting performance review, it can help you assess your decisions more deliberately. The tool does not make you profitable by itself and does not replace sound risk management; it helps you evaluate your own decisions on a more informed basis.
The best journal is not necessarily the one that collects the most data. It is the one you use consistently and whose metrics answer real questions.
Conclusion: measure the process, not just the result
Net profit matters, but it is only one part of the trading-performance picture. Win rate, average win and loss, expectancy, profit factor and drawdown each illuminate a different aspect of the same process. Interpreted together, they tell you much more than any single metric can on its own.
Regular journaling and review can help you identify recurring patterns, test assumptions and set concrete improvement goals. It cannot guarantee profits, but it can reduce the chance that you judge your performance solely from memory or a few striking trades.
If you want to organise your trades and review your results more consistently, explore the Pillinger Works Trading Journal. The point is not to let statistics make decisions for you, but to give your decisions a better foundation.
Important note
This article is for educational purposes only and does not constitute investment advice. Past performance does not guarantee future results. Trading involves the risk of loss.